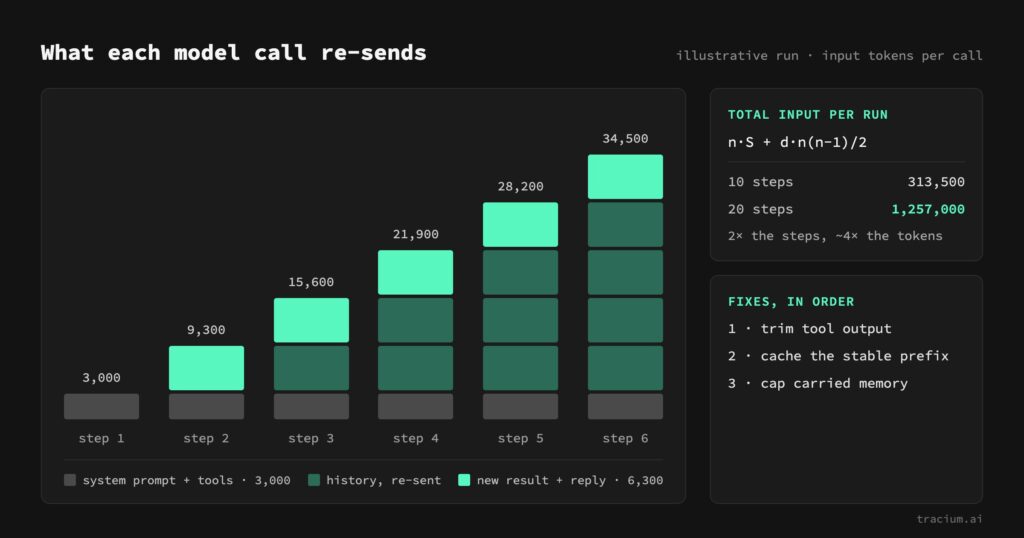
AI agent cost grows with every step because of context growth: model APIs are stateless, so most agents resend the whole conversation, including every earlier tool result, on each model call. When each step adds a similar amount of text, the total input tokens of a run grow with the square of the number of steps, so doubling the steps can roughly quadruple the bill. You can see it in the input tokens of each model-call span, and fix it by adding less, caching the repeated prefix and capping memory.
Key takeaways
- Each step pays again for everything before it, so cost per run grows faster than the number of steps.
- The usual culprit is tool output: whole pages, files or query results appended to the conversation.
- In a trace, context growth is input tokens climbing span after span within one run.
- Trim tool output first, then cache the stable prefix, then cap memory.
Why does cost grow faster than the number of steps?
Because step k re-reads everything from steps 1 to k-1. With a fixed prompt of S tokens and d tokens added per step, the input of a run is:
step k input = S + (k - 1) * d
total input  = n * S + d * n * (n - 1) / 2
Here is an illustrative example with round numbers, not data from a real customer. A research agent has a 3,000-token system prompt with tool definitions; each step a fetch tool returns about 6,000 tokens of raw page text and the model writes about 300 tokens. At Claude Sonnet 5.5 list prices as of October 2026, $2 per million input tokens and $10 per million output tokens (Anthropic pricing):
| Run | Input on the last step | Total input | Cost per run |
|---|---|---|---|
| 10 steps | 59,700 | 313,500 | $0.66 |
| 20 steps | 122,700 | 1,257,000 | $2.57 |
Twice the steps, almost four times the cost.
I hit exactly this on a project I was working on: one feature cost $0.1583 per agent call until I saw its context grow on every step. After the fix it cost $0.000099 per call.
How does context growth show up in traces?
As input tokens climbing from one model-call span to the next inside a single run. With OpenTelemetry instrumentation such as OpenLLMetry, every model call is already a span with its token counts.
- Open one of your most expensive runs and read the input tokens on each model-call span in order.
- Look at the tool span just before each big jump: that tool is filling the context.
- Add cache tokens: Anthropic reports them separately from input tokens, so a cached run can look flat while its context grows.
Tracium’s trace view shows each span’s model, tokens and cost; parent spans carry subtree totals, so read per-span values (Reading a trace).
How do you fix context growth?
Reduce what each step adds, cache what has to repeat, and cap what the agent carries forward, in that order. On the same illustrative 20-step run:
| Change | Input on the last step | Cost per run |
|---|---|---|
| Baseline: raw tool output appended | 122,700 | $2.57 |
| Tool output trimmed to ~500 tokens per step | 18,200 | $0.48 |
| Trimmed, plus prompt caching | 18,200 | $0.12 |
- Trim tool output. Return only what the next step needs: the matching rows, the relevant paragraphs, an ID and a one-line summary. Keep the full result elsewhere, fetchable on demand.
- Cache the stable prefix. Anthropic’s prompt caching reuses an identical prefix of tools, system prompt and messages; on Sonnet 5.5 a cache read costs $0.10 per million tokens and a 5-minute cache write $2.50 (prompt caching). A timestamp early in the prompt invalidates everything after it.
- Cap memory. Carry a running summary plus the last few steps instead of the whole history. Input then stops growing; test task success as well as cost.
How do you know the cost stays down after the fix?
Test per-step input in CI and watch cost per run, not total spend, in production.
from traceloop.sdk import Traceloop
from opentelemetry.sdk.trace.export.in_memory_span_exporter import InMemorySpanExporter

exporter = InMemorySpanExporter()
Traceloop.init(app_name="agent-test", exporter=exporter, disable_batch=True)

def context_tokens(span):
    a = span.attributes
    inp = a.get("gen_ai.usage.input_tokens", a.get("gen_ai.usage.prompt_tokens", 0))
    return (inp + a.get("gen_ai.usage.cache_read_input_tokens", 0)
            + a.get("gen_ai.usage.cache_creation_input_tokens", 0))

def test_agent_context_stays_bounded():
    run_agent(FIXED_TASK)  # same task every run
    llm_spans = sorted((s for s in exporter.get_finished_spans()
                        if context_tokens(s) > 0), key=lambda s: s.start_time)
    tokens = [context_tokens(s) for s in llm_spans]
    growth = (tokens[-1] - tokens[0]) / max(len(tokens) - 1, 1)
    assert max(tokens) < 12_000, tokens
    assert growth < 1_000, tokens
In production, compare the fixed workflow’s cost per run before and after the deploy; Tracium’s Workflows page shows runs and spend per workflow (Workflows).
When is Tracium a good fit, and when is another tool better?
Any tool showing per-span token counts reveals this, including Langfuse, Arize Phoenix and LangSmith. Tracium fits if you already emit OpenTelemetry and want cost per run, workflow and customer without a vendor SDK, or need to self-host. If you mainly need to evaluate whether a trimmed agent still answers correctly, a tool with stronger evaluations may fit better.
FAQ
Is AI agent cost really quadratic?
The input side is, when every step appends a similar amount and nothing is removed. Output tokens usually grow linearly, but on long runs input dominates the bill.
Which step should I fix first?
The tool whose output causes the biggest jump in input tokens on the next model call, usually a fetch, search or database tool.
Does prompt caching fix context growth?
It makes the repeated part much cheaper but does not stop the growth. Latency still rises and long runs still approach the context window, so trim what you add first.
Context growth is why agents that looked cheap in testing get expensive in production. The open-source Tracium collector and dashboard are on GitHub, or sign up free at app.tracium.ai, point your OpenTelemetry exporter at it and open your most expensive run.