A silent retry loop is an AI agent step that calls the model again after a bad result, such as invalid JSON or a failed tool call, and eventually succeeds. Every call returns successfully, so error alerts stay quiet, but each attempt is a new billed request, often with a longer prompt than the last. You find them by counting calls per run for each step, not by watching error rates.
- SDK retries (OpenAI and Anthropic Python SDKs retry twice by default) happen inside one traced call, so they show up as latency, not as extra calls.
- Application retries (parse-and-retry, self-correction, tool-error loops) create one model call per attempt, and that is where cost hides.
- The signal is calls per run per step, and cost per run per workflow version.
What is a silent retry loop in an AI agent?
It is any code path that re-asks the model until the answer passes a check. Common shapes: a try/except around json.loads, a validator that sends the error back to the model, or an agent that retries a tool call after the tool fails. None of them raise an error when they finally succeed.
Why do retries show up as cost, not as errors?
Because the failure is in your logic, not in the API call. The provider returned a valid response, the span status is OK, and only the content was wrong. If the loop appends the failed output and the error message to the conversation, each attempt also sends more input tokens than the one before.
Where do retries hide?
There are two layers, and they look very different in a trace.
| Layer | Example | In the trace |
|---|---|---|
| SDK transport retry | The OpenAI Python SDK retries connection errors, timeouts, 408, 409, 429 and 5xx twice by default (openai-python) | One span, longer duration. OpenLLMetry wraps create(), and the SDK retries below it. |
| Application retry | Re-ask on invalid JSON, self-correction, tool-error loop | One model span per attempt, each priced from its own tokens |
So if a step’s p95 latency jumps but its call count does not, look at rate limits. If the call count per run rises, look at your own loops.
How do you spot one in a trace?
Look for the same step name repeated inside one run. In a trace viewer that is several sibling spans with the same name under one parent (see reading a trace). Across many runs, group calls by workflow and span name and divide calls by runs. A step that should run once per run but averages 1.4 is retrying on a large share of runs.
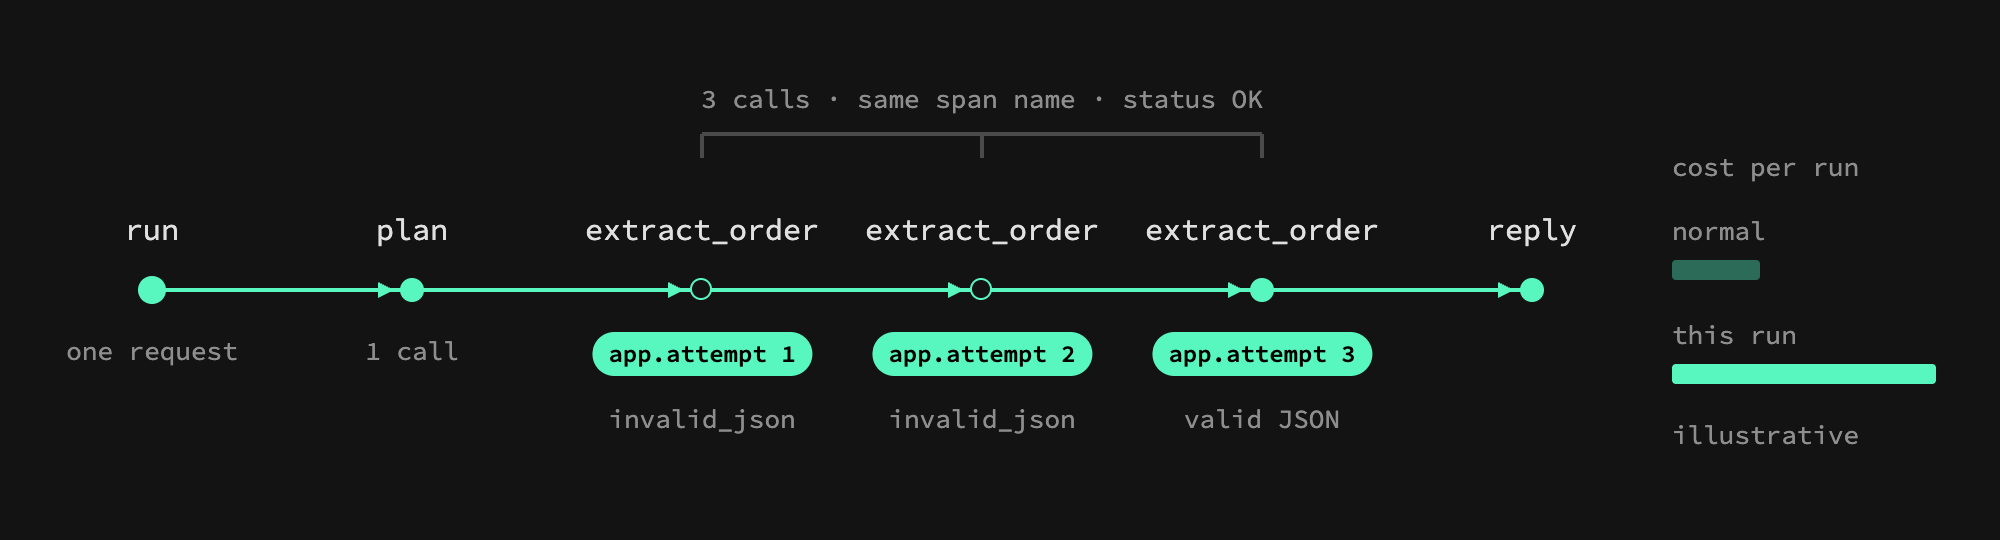
In Tracium you can ask this directly with POST /v1/query, or the same query through its MCP server:
{
  "view": "calls",
  "metrics": ["calls", "runs", "cost"],
  "dimensions": ["workflow", "span_name"],
  "formulas": [{"name": "calls_per_run", "expr": "calls / runs"}],
  "order_by": "calls_per_run",
  "limit": 20
}
The runs view also has a call_count field, so you can list the runs with the most calls and open them.
How much does a retry loop cost?
An illustrative example: an extraction step costs $0.004 per call and runs 10,000 times a day. A validation retry fires on 15% of runs and takes two extra attempts. That is 3,000 extra calls, or $12 a day and about $360 a month, from a step whose error rate is zero.
Context that grows call after call is the same mechanism at a larger scale. In my own case, one Aqtos feature went from $0.1583 to $0.000099 per agent call once Tracium showed the context growing on every call.
Which span attributes make retries visible?
Wrap each attempt in its own span and record the attempt number and the reason. OpenLLMetry already records the model call itself with its model and token counts, so you only add the wrapper:
import json
from opentelemetry import trace

tracer = trace.get_tracer(__name__)

def extract_order(client, messages, max_attempts=2):
    for attempt in range(1, max_attempts + 1):
        with tracer.start_as_current_span("extract_order") as span:
            span.set_attribute("app.attempt", attempt)
            resp = client.chat.completions.create(
                model="gpt-4o-mini", messages=messages
            )
            try:
                return json.loads(resp.choices[0].message.content)
            except json.JSONDecodeError:
                span.set_attribute("app.retry_reason", "invalid_json")
    raise ValueError("no valid JSON after %d attempts" % max_attempts)
Tracium stores attributes outside its reserved namespaces (gen_ai.*, llm.*, traceloop.*, tracium.*) as custom attributes, so attr.app.retry_reason can be filtered and grouped like any other field (attribute reference).
How do you stop retries from inflating the bill?
- Cap attempts in code, and fail loudly when the cap is hit.
- Prefer structured output modes or a stricter prompt over re-asking.
- Send back the validation error, not a growing transcript of every failed attempt.
- Version your workflow with
tracium.workflow.versionon the resource. Tracium’s versions table shows cost per run per release and flags a large rise (workflows docs). - Keep spend anomaly alerts on. Tracium scores daily cost per workflow against a 28-day baseline, which catches a sudden loop; a slow creep is better caught by the calls-per-run query above.
FAQ
Do SDK retries cost extra tokens?
The SDK resends the same request after a connection error, timeout, 429 or 5xx, inside one traced call. Your trace shows a single call with its final token counts and a longer duration. [CHECK: whether a provider bills for a request that timed out client-side and was retried]
Why doesn’t my error-rate alert catch retry loops?
Every model call in the loop succeeds, so the span status is OK and the error rate does not move. Only cost per run and calls per run go up.
How many retries are reasonable for an LLM agent step?
One retry with a clear error message fixes most format problems. If a step needs more than that on a meaningful share of runs, fix the prompt or the output format instead of raising the cap.
If you want to see calls per run for every step without writing queries, try the open-source repo at github.com/antonij-tracium/tracium or sign up free at app.tracium.ai.