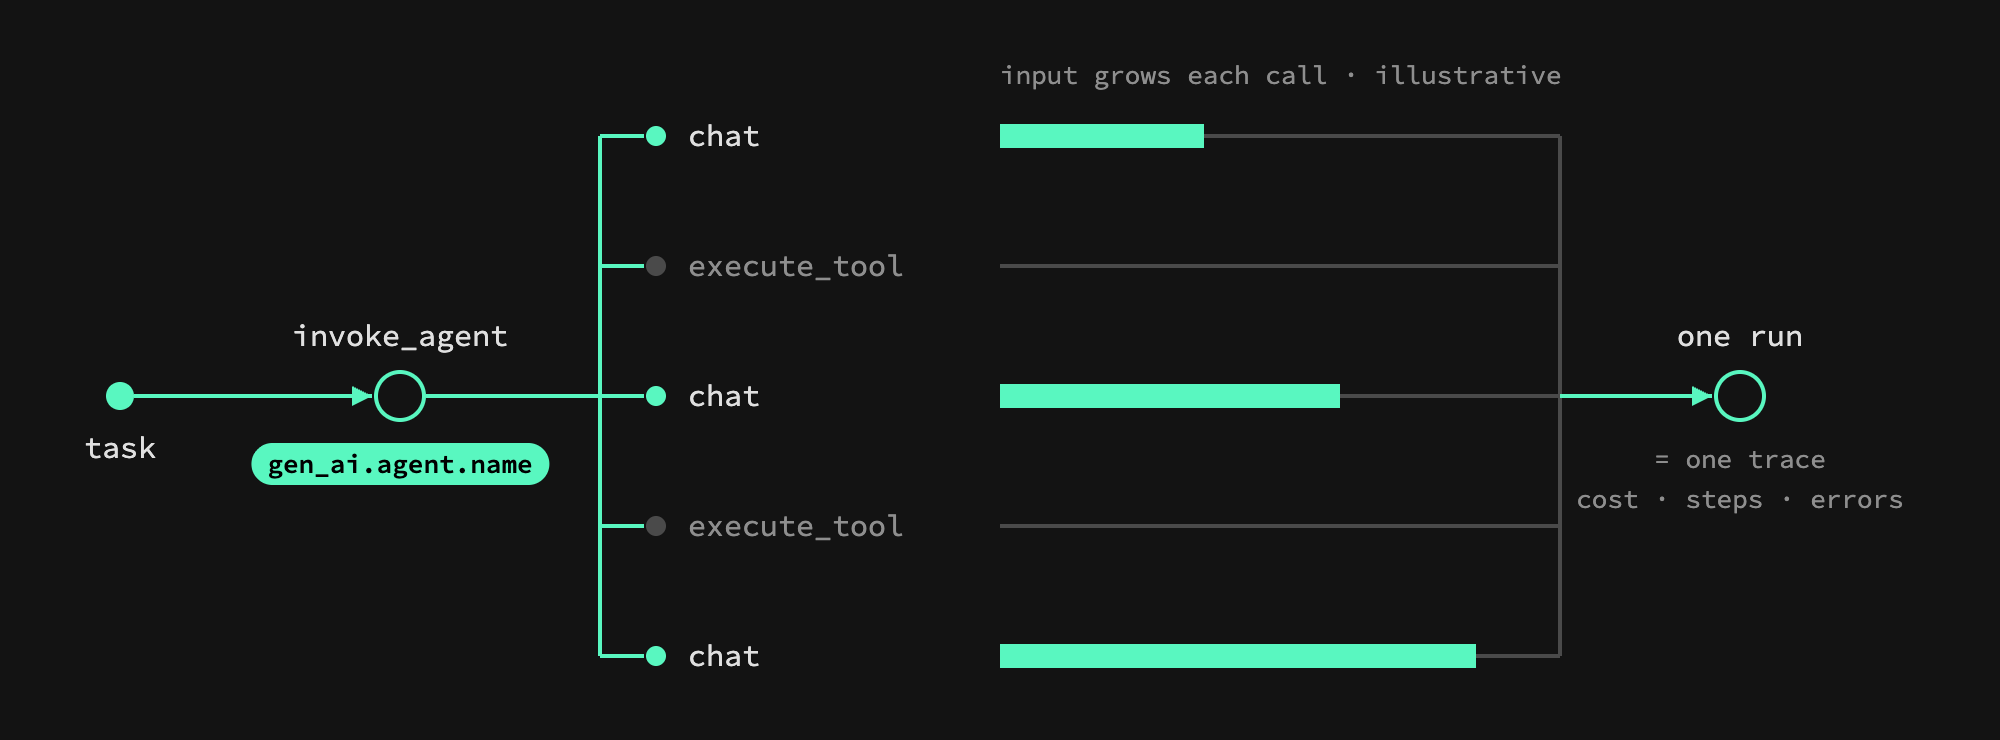
AI agent observability is recording every step of an agent’s run, each model call, tool call and handoff, as one connected trace, with the model, tokens, cost, latency and errors of each step. It differs from LLM observability, which looks at single model calls, and from APM, which looks at requests and services. The question it answers is what one run of the agent did and what it cost.
Key takeaways
- The unit is the run, not the call: one trace per task, with every step as a span.
- Agents fail and overspend through loops, retries and growing context, which only show up across steps.
- OpenTelemetry’s GenAI conventions give agent, model and tool spans standard names, so any OTLP backend can read them.
What is AI agent observability, in one paragraph?
It is tracing applied to agents. A run starts when the agent gets a task and ends when it answers or gives up. In between it may call a model ten times, call five tools and hand off to a sub-agent. Agent observability records all of that as a tree of spans under one trace, so you can see the path the agent took, where time and tokens went, and which step failed.
How is it different from LLM observability and APM?
They measure different units. APM measures requests and services, LLM observability measures model calls, and agent observability measures runs made of many calls.
| APM | LLM observability | Agent observability | |
|---|---|---|---|
| Unit | Request, service | Model call | Agent run (trace) |
| Typical question | Which service is slow? | What did this prompt return and cost? | Why did this run take 14 steps and cost 20 times the usual? |
| Key signals | Latency, errors, throughput | Prompt, completion, tokens, model | Steps, tool calls, context growth, cost per run |
The categories overlap: an agent trace contains LLM spans, and both usually run on the same tracing infrastructure as APM.
What do you observe in an agent?
Runs, steps, tool calls, models, tokens and cost, each attached to the span that produced it.
- Run: the trace, with total duration, cost and outcome.
- Agent and workflow: which agent ran, and which version of its prompt or code.
- Model calls: model name, input and output tokens, cached tokens, latency, finish reason.
- Tool calls: which tool, which arguments, how long, whether it failed.
- Customer: who the run was for, so cost can be split per customer.
Why do agents need it?
Because the expensive failures happen between calls. An agent that retries a failing tool, loops on the same plan or resends its whole history each step looks fine call by call and terrible per run.
I hit this in Aqtos, our own product: one feature resent a context that grew exponentially across calls. Tracing it per run showed the growth, and fixing it took that feature from $0.1583 to $0.000099 per agent call. No single call looked wrong.
What role does OpenTelemetry play?
OpenTelemetry is the transport and the vocabulary. Traces travel over OTLP, and the GenAI semantic conventions name what is in them: gen_ai.operation.name values such as invoke_agent, chat and execute_tool, plus gen_ai.agent.name, gen_ai.request.model and gen_ai.usage.input_tokens. You rarely write these by hand: instrumentation libraries such as OpenLLMetry emit the model and token attributes when they wrap your model client, and its @agent and @tool decorators mark the surrounding spans.
Because the names are standard, the backend is replaceable. The same spans can go to Tracium, Langfuse, LangSmith or Phoenix, as long as the backend reads the conventions your library emits.
What does a good agent observability setup give you?
Three things: a readable trace per run, cost you can split by agent, model and customer, and a warning when cost or error rates shift.
In Tracium, an open-source OTLP backend I build, that looks like this:
- Traces are grouped into workflows by
gen_ai.agent.name, then OpenLLMetry’s workflow or entity name, thenservice.name(Workflows). - Each span is priced on arrival from its model and tokens, and the trace view shows every step’s tokens, cost and timing (Reading a trace).
- Setting
tracium.user.idon every span, or on the resource for a single-customer service, splits spend per customer (Cost & usage). - Setup checks flag gaps such as workflows without
gen_ai.agent.nameor unpriced models, and anomaly detection flags spikes and drops in cost, error rate and runs.
Tracium is a good fit when cost and reliability per run are the main questions. If you need evaluations or prompt management alongside traces, Langfuse or LangSmith cover more of that.
FAQ
What is the difference between agent observability and LLM observability?
LLM observability looks at individual model calls: prompt, completion, tokens and cost. Agent observability groups those calls with tool calls and handoffs into one trace per run, so you can see the whole path and its total cost.
Do I need a special SDK for agent observability?
No. The standard OpenTelemetry SDK plus a GenAI instrumentation library is enough, and any backend that accepts OTLP and reads the GenAI conventions can store and show the traces.
What should I measure first?
Cost and step count per run. They show loops, retries and context growth sooner than per-call metrics do, and they map directly to your bill.
If you want to see your own agents’ runs as traces with cost per step, run Tracium from the open-source GitHub repo with docker compose up, or sign up free at app.tracium.ai.