Claude OpenTelemetry export, released in beta on October 14, 2026, lets the Claude Platform send traces of Messages API requests, tool calls and Managed Agents sessions to any backend that accepts OTLP. There are two sources: the Claude SDK emits a CLIENT span for each API call to the tracer provider your app registers, and a destination added in the Claude Console makes the API itself send SERVER spans. Both use GenAI semantic-convention attributes such as gen_ai.request.model and gen_ai.usage.input_tokens, so backends can read them without a Claude-specific plugin.
Key takeaways
- SDK tracing needs only a registered OpenTelemetry tracer provider. API tracing needs an org admin and a public HTTPS endpoint on port 443.
- Prompts are excluded by default (
metadata_only). - One request can produce several spans that carry token counts. Count tokens from one source only, or you will double-count cost.
What exactly did Anthropic release?
Anthropic released two ways to get traces, and you can use either one or both. The OpenTelemetry overview describes them like this:
| SDK tracing | API tracing | |
|---|---|---|
| Set up in | Your code | Claude Console (or Admin API) |
| Permission | None | Org admin |
| Covers | Clients using the Claude SDK | Any client, including server tools and model runs inside a request |
| Main span | anthropic.messages.create, kind CLIENT | anthropic.messages.create, kind SERVER, plus anthropic.model_request |
The SDK emits spans in Python, TypeScript, C#, Go, Java, PHP and Ruby.
How do I turn on tracing in the Claude SDK?
Register a tracer provider before your first API call; the SDK picks it up automatically. Until one exists, its spans are no-ops.
- Install the packages:
pip install --upgrade anthropic opentelemetry-sdk opentelemetry-exporter-otlp-proto-http. The feature is in beta, so pin your SDK version. - Register a provider with an OTLP exporter. This one sends to Tracium Cloud, per our OpenTelemetry setup docs.
import os
from anthropic import Anthropic
from opentelemetry import trace
from opentelemetry.sdk.resources import Resource
from opentelemetry.sdk.trace import TracerProvider
from opentelemetry.sdk.trace.export import BatchSpanProcessor
from opentelemetry.exporter.otlp.proto.http.trace_exporter import OTLPSpanExporter

provider = TracerProvider(resource=Resource.create({"service.name": "support-agent"}))
provider.add_span_processor(BatchSpanProcessor(OTLPSpanExporter(
    endpoint="https://api.tracium.ai/v1/traces",
    headers={"Authorization": f"Bearer {os.environ['TRACIUM_API_KEY']}"},
)))
trace.set_tracer_provider(provider)

client = Anthropic()
message = client.messages.create(
    model="claude-sonnet-4-6",
    max_tokens=1024,
    messages=[{"role": "user", "content": "Hello, Claude"}],
)
Anthropic(open_telemetry={"traces": {"content_mode": "content"}}) records prompts and responses, and open_telemetry=False turns spans off for one client. If you already run OpenLLMetry’s Anthropic instrumentation, keep only one of the two, or every call produces two LLM spans.
How do I add an API destination in the Claude Console?
An org admin opens the OpenTelemetry settings page, clicks Add destination, and enters an OTLP/HTTP endpoint. The API tracing guide lists these requirements:
- The endpoint must be HTTPS on port 443 with a hostname, not an IP address. Don’t add
/v1/tracesyourself. A self-hosted collector on port 4318 needs a reverse proxy in front of it. - Credentials go in request headers. You also pick the content mode and workspaces.
- Use Test to send an
anthropic.testspan, then filter onservice.name = claude-platform.
API spans join your own traces through the W3C traceparent header the SDK sends. If its sampled flag is off, the API emits no spans. Delivery is at-least-once and best effort, so spans are not a billing record; Anthropic points to its Usage API for that.
How do I count tokens without double counting?
For each request, count tokens from one span source only. The SDK’s CLIENT span, the API’s SERVER span and each anthropic.model_request span can all carry gen_ai.usage.*. Anthropic says to sum either the SERVER or the model-request spans, never both, and to prefer API spans over SDK spans.
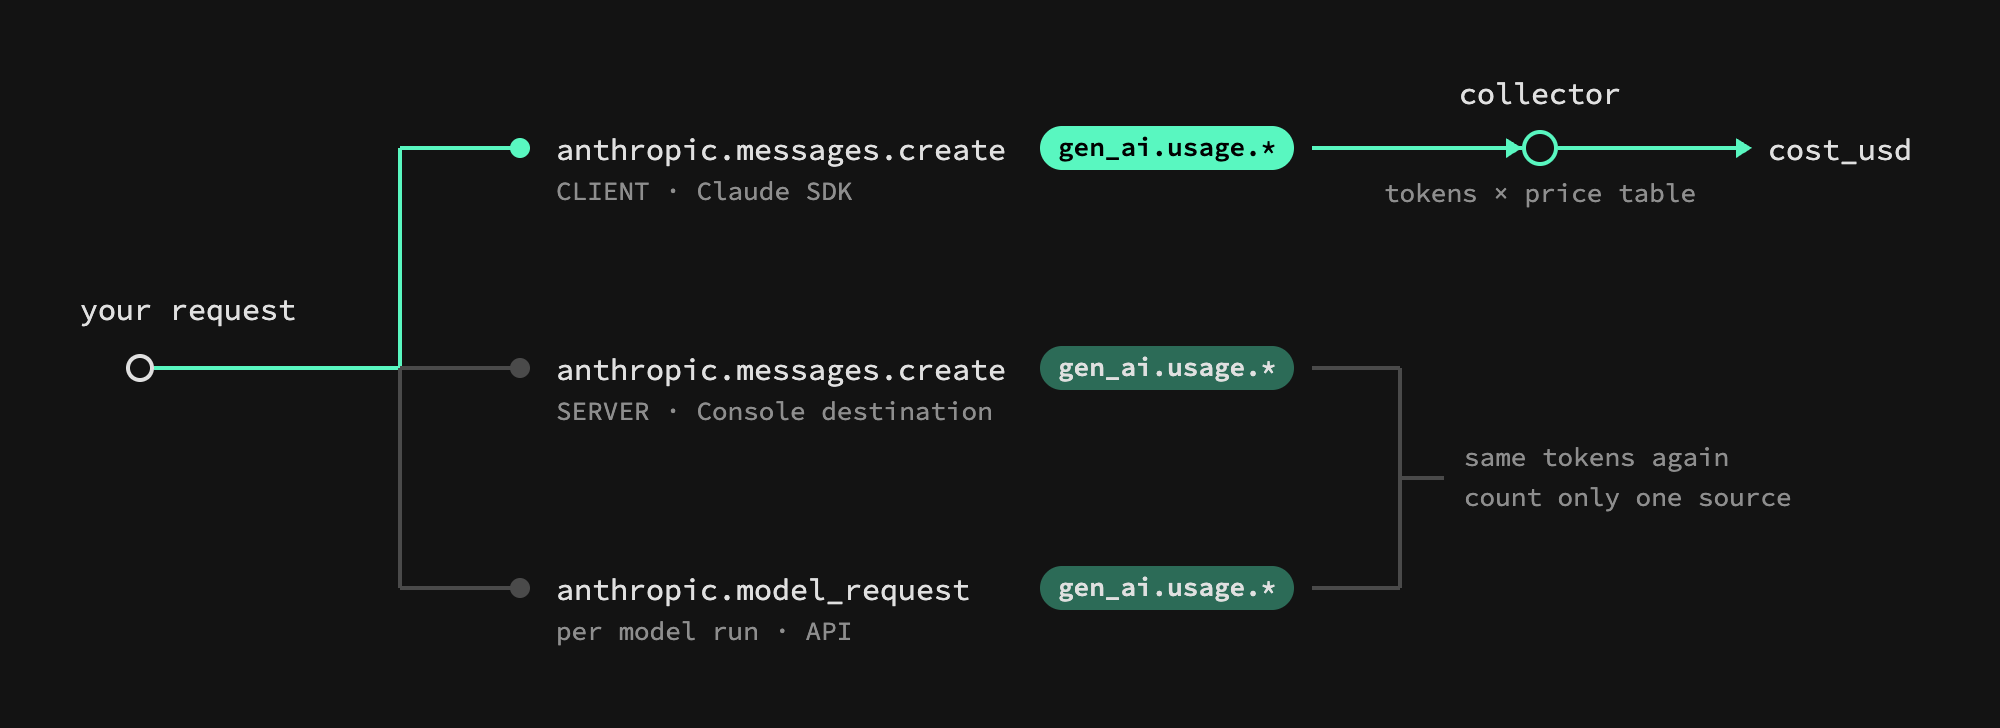
Two details matter for cost. gen_ai.usage.input_tokens already includes cache reads and writes, and cache writes are reported as gen_ai.usage.cache_write.input_tokens (see the span reference).
When is Tracium a good fit?
Tracium fits when your question is “what does each agent and model cost?” Its open-source collector prices tokens and rolls spend up by workflow and model. Today, send Tracium only the SDK spans. Tracium sums cost across every span in a trace, so adding a Console destination to the same workspace would count the request again.
If you mainly need prompt evals or every API-side step, Anthropic’s listed partners, including Langfuse, LangSmith, Arize and Braintrust, are a better fit.
FAQ
Does Claude OpenTelemetry capture prompts?
Not by default. Both the SDK and Console destinations start in metadata-only mode, which records IDs, timing, status and token counts. Full content adds prompts and responses, capped at 0.75 MB per span by default.
Is this the same as Claude Code telemetry?
No. Claude Code, the Agent SDK and Cowork have separate monitoring docs. This feature covers the Messages API, Managed Agents and the Claude SDKs.
Can I use it with Amazon Bedrock?
SDK tracing works on any cloud platform; on Bedrock clients gen_ai.provider.name is aws.bedrock. API tracing covers Claude Platform and Claude Platform on AWS.
Claude’s native spans make cost and latency visible without wrapper libraries. For spend per agent and model on top, try the open-source Tracium repo or sign up free at app.tracium.ai.